
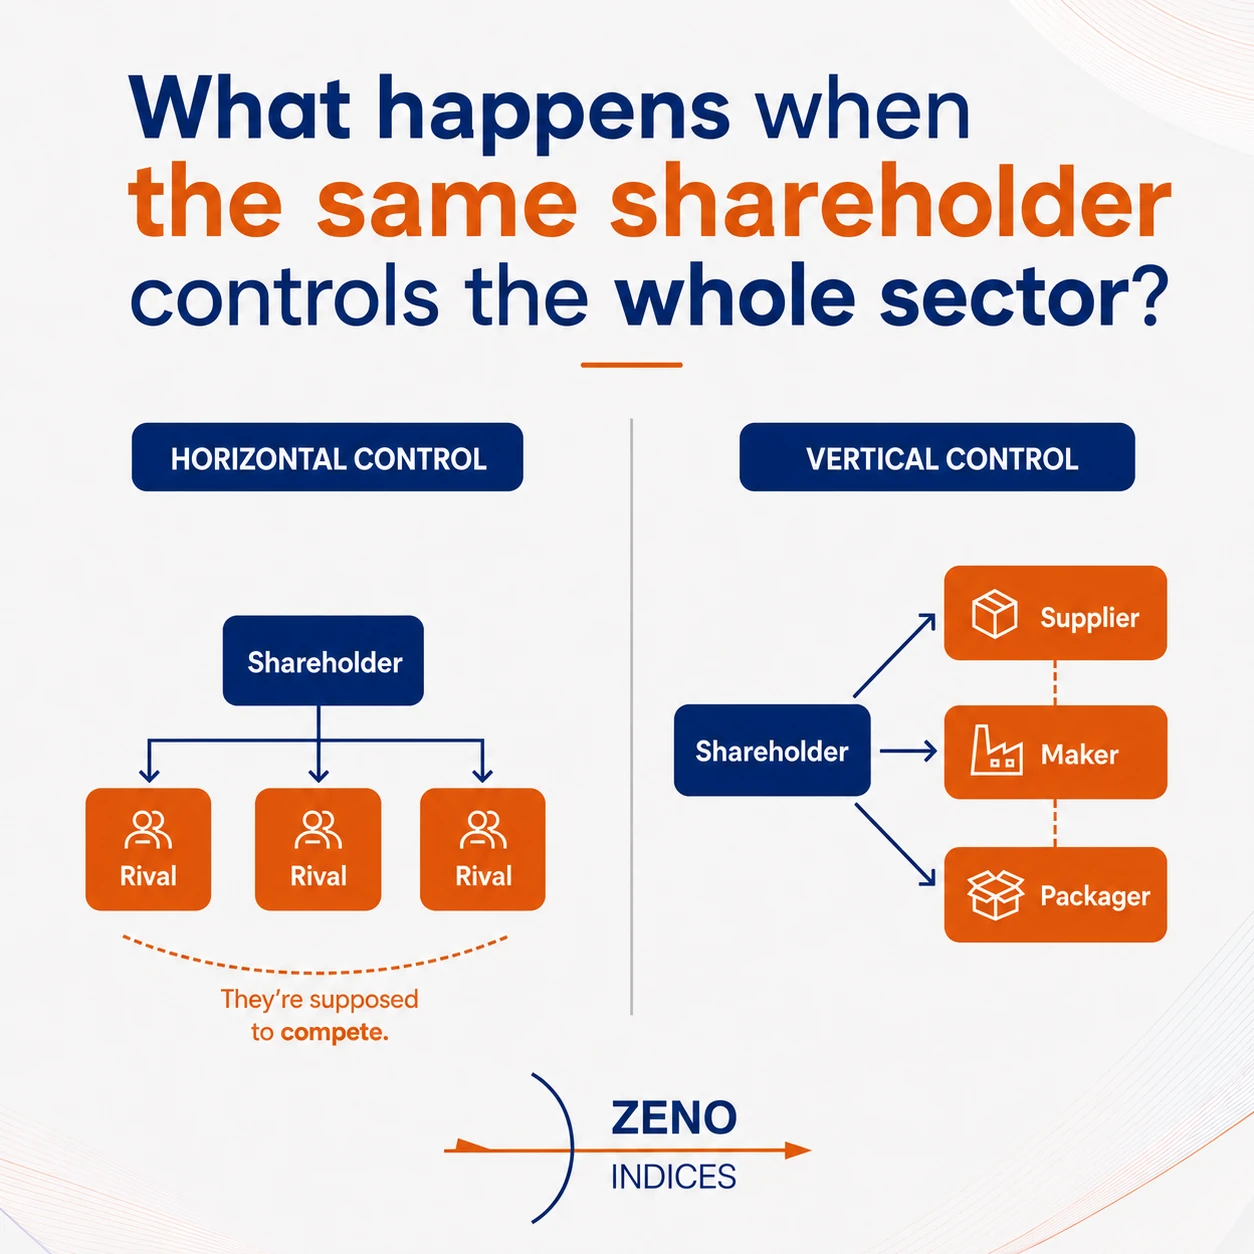
Investing rests on a simple premise: a shareholder wants the company they back to win, to compete and outperform its rivals. But when a single investor holds stakes across competing firms, or across a supply chain, their interest is no longer any one company winning. It is the combined performance of the whole portfolio. And those stakes need not be large: a few percent in each firm, spread across a sector, can be enough.
This is common ownership, and its consequences are actively debated among economists. What is not in dispute is the structural precondition: the same investors increasingly sit atop firms that are supposed to compete. Before any argument about effects can be had, that structure has to be identified.
We approach common ownership through the lens of control. It is not enough to know who holds shares; what matters is who actually holds power over a company. Identifying common ownership therefore means measuring control, not counting stakes. This is where the ZENO Power Index comes in.
The share register shows ownership, not control
A register reports ownership as percentages. Read that way, an asset manager holding four or five percent of dozens of companies may look like a passive minority.
But ownership and control are not the same. What matters is not the size of a stake but how it sits relative to all the others, and through which channels influence flows. A few percent can confer decisive control where the rest of the register is fragmented, and little where it is concentrated. This is why common ownership needs no large positions: an investor present across every major player in a sector, holding only a few percent of each, can still emerge as the most powerful controller of them all.
The ZENO Power Index measures this directly: a continuous reading of who actually controls a company, by how much, and through which channels. It is this measure, not the raw shareholding, that reveals where common ownership genuinely concentrates power. Throughout, a firm's Ultimate Controlling Owner (UCO) means its single most powerful controller on the ZENO Power Index.
Common ownership comes in two shapes: horizontal and vertical
We identify two distinct forms of common ownership:
- Horizontal common ownership: one controller sitting atop a company and its direct competitors. The question it raises is about competition between rivals in the same market.
- Vertical common ownership: one investor controlling firms at different stages of a single value chain, a supplier, a manufacturer, a distributor. The question here is about a whole chain aligned under one owner rather than each link acting on its own.
The two shapes are not mutually exclusive. The same controller can sit atop a sector's direct rivals and, at the same time, run down the chain that supplies them, so that a single market carries horizontal and vertical common ownership at once.
The ZENO Power Index lets us map both across Europe's largest companies, finding where the same controller recurs across a sector, or sits over a connected chain.
One controller often sits atop a whole sector
Applied across the STOXX 600, the ZENO Power Index reveals just how often a single shareholder rises to the top of a sector. BlackRock alone is the Ultimate Controlling Owner (UCO) of companies in every major sector of the index, and in several it holds that position across a striking share of the field:
| Sector | BlackRock as top controller |
|---|---|
| Consumer Discretionary | 23% |
| Communication Services | 20% |
| Real Estate | 20% |
| Utilities | 13% |
| Health Care | 12% |
It holds these positions with no more than a few percent of each firm, and the pattern is spreading. Driven by the long rise of passive and index investing, the same few asset managers have steadily accumulated control across more of the market, year after year. BlackRock alone was the top controller of 6% of the STOXX 600 in 2015, 10% in 2020, and 20% today.
And it goes beyond the top spot. Common ownership does not require being the Ultimate Controlling Owner; being the second most powerful, the UCO2, is often enough to shape a company's governance. Beyond the fifth of the index it already tops, BlackRock is the UCO2 of a further 15% or so, and Vanguard of around 10%. Between them, one of just two American asset managers ranks among the two most powerful controllers of a large part of Europe's biggest companies.
In semiconductors, one controller spans the whole value chain
The clearest vertical example sits in Information Technology. The ZENO Power Index places BlackRock as Ultimate Controlling Owner, and Vanguard as the second most powerful controller, over a connected slice of Europe's chip industry:
- ASML: builds the lithography machines that pattern the chips
- Infineon: produces the chips themselves
- Besi: makes the equipment that assembles and packages them
Three links in one value chain, the same two UCOs on top of all of them. It is a textbook case of vertical common ownership: not rivals in a single market, but successive stages of one industry aligned under a single controlling pair.
Why common ownership matters
Below are some of the effects specialists debate about common ownership.
For horizontal ownership, the concern is competition. To an investor controlling several rivals, one of them winning is close to zero-sum, and a costly fight such as a price war can leave the whole portfolio worse off. So the argument runs that competition is quietly discouraged: rather than chase advantage, management settles for parity, or retreats into a comfortable niche, and the sector's overall profitability comes to matter more than any single firm's performance.
Two things tend to follow. A firm that holds back this way risks being overtaken by rivals not under common control. And because no firm has much reason to undercut the others, prices or fees across the sector can drift upward together: not through any explicit agreement, but because a shared controller gives every firm the same incentive to keep them high. A related concern surrounds mergers and acquisitions, where a controller holding both sides of a deal lacks the opposing interest that normally keeps the price honest.
Vertical ownership is far less studied, and the evidence so far is more favourable. Much of the research finds that when one controller spans a supply chain, it can coordinate and monitor the links, smoothing the frictions and hold-up problems between supplier and customer and improving efficiency. But the same alignment cuts both ways for the individual firm: a controller optimising the chain as a whole may be content for one link to accept thinner margins so another does better. The chain's total value rises, yet a shareholder who holds only that one link ends up with the short end. Whether vertical ownership mostly smooths the chain or quietly redistributes it is a question the literature has yet to settle.
What it means for a minority shareholder
If you hold a minority stake in a single company, directly or through a pension or index fund, you are not a common owner. Your interest is simply that your company succeeds and, where it competes, wins. If its most powerful controller is a common owner, that controller's interest may not be aligned with yours: it is hedged across the whole field, while you are exposed to the one firm.
The takeaway
As common ownership deepens, the ability to measure it stops being an academic nicety and starts being a strategic necessity.
A register that reports four or five percent per firm will never show it. ZENO's Z-CAT engine maps the full ownership chain and the ZENO Power Index ranks the controllers it finds, which is what makes horizontal and vertical common ownership identifiable in the first place.
"A share held for control is worth more than a share held for portfolio." Luc Leruth, Founder & CEO, ZENO-Indices
© ZENO-Indices S.A. All rights reserved August 2026.
A ZENO-Indices analysis, prepared by Charles Meuwly. Figures from the ZENO Power Index applied to the STOXX
600, Z-CAT control assessment.